Another way of doing a chi-square analysis is by using Python. We are going to look at this approach next.
Open a new Python project, click copy button and paste the contents into the the first frame.
Run the code in the first frame.
This code imports libraries from Python
Click the + to add a new frame, click copy button and paste the contents of the clipboard into this frame.
This code reflects creating a data frame from the whole population of different generations
I multiplied the percentage of each population times 600, our random sample number.
Run the code in the first two frames.
Click the + to add a new frame
Click copy button to put the contents on the clipboard. Paste it into the frame.
This code converts the data frame into a cross table for ease of calulations.
Run the code in the first three frames.
Your result should look like the text below.
Click the + to add a new frame
This code reflects creating a data frame from our random sample of 600 customers surveys.
Click the + to add a new frame
Click copy button to put the contents on the clipboard. Paste it into the frame.
This code converts the data frame into a cross table for ease of calulations.
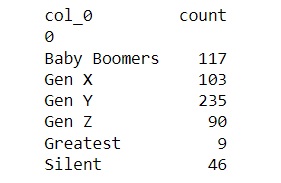
Run the code in the first four frames.
Your result should look like the text below.
Now we are going to convert the numbers in the cross table into percentages, based on the 600 sample size.
Click the + to add a new frame
Click copy button to put the contents on the clipboard. Paste it into the frame.
This code converts the data in cross table into ratios.
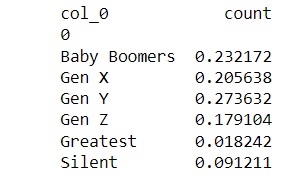
Run the code in the first five frames.
Your result should look like the text below.
Now we are going to get the expected counts from the all_population data.
Click the + to add a new frame
Click copy button to put the contents on the clipboard. Paste it into the frame.
This code converts prints the counts for the all_population data.
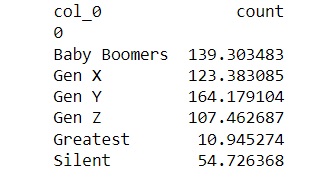
Run the code in the first six frames.
Your result should look like the text below.
Now we are going to calculate chi-square.
Click the + to add a new frame
Click copy button to put the contents on the clipboard. Paste it into the frame.
This code converts prints the value of chi-square.
Run the code in the first seven frames.
Chi-square is 42.06. Does this agree with your previous calculations?
Now we need to see if we should accept or reject our null hypothesis.
We will look at p value and critical values.
P-values and critical values are so similar that they are often confused.
They both do the same thing: enable you to support or reject the null hypothesis in a test.
But they differ in how you get to make that decision. In other words, they are two different approaches to the same result.
Click the + to add a new frame
Click copy button to put the contents on the clipboard. Paste it into the frame.
This code converts prints the critical value.
Run the code in the first eight frames.
You should get 11.070497693516351 as your critical value.
Since the chi-square value (42.06) is greater than the critical value (11.070497693516351), we can reject the null hypothesis which states that our customer's ages do not follow this model's data.
Now we are going to look at the p-value.
Click the + to add a new frame
Click copy button to put the contents on the clipboard. Paste it into the frame.
This code converts prints the p-value.
Run the code in the first nine frames.
Since the chi-square value (42.06) is greater than the p-value (5.72080661e-08]), we can reject the null hypothesis.