Data Preprocessing: Missing Data and One Hot-Encoding Tutorial
Day 2: Graphing length, median and mean lengths
Click on the + key to create a new frame then click copy text button and paste the contents into the frame.
Run the code in all of the frames.
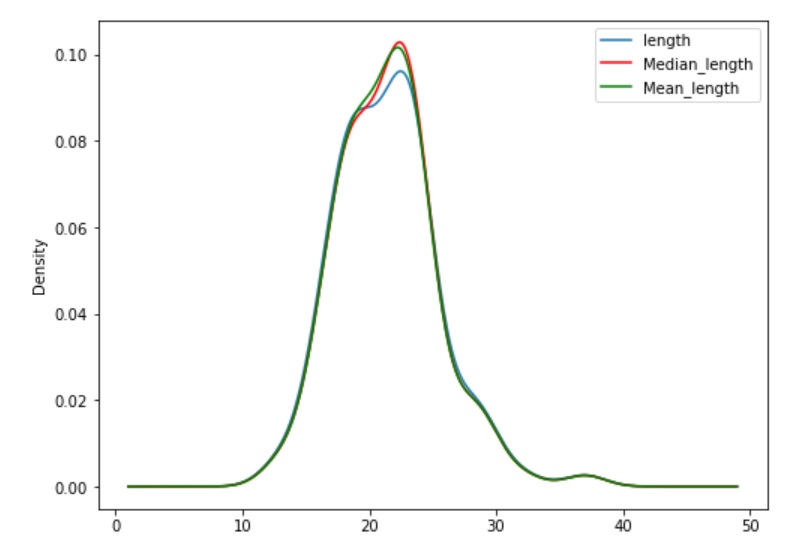
Your output should look like the graph below.
As you can see the graph's shape, looks like a bell. This is also called a normal distribution curve. The mean, 21.44 is in the center of the curve. Larger values for length fall on right side of the mean and smaller values fall on the left side of the mean. If the graph has a bell shape and is not skewed, then it is best to replace the missing values with the mean. As you can see the graph is quite narrow, which means that the values are not very far from the mean. If the bell was wider at the base, then the values would be farther from the mean.
The code plots the figure and graphs length, median length and mean length. The legend is printed also. Median line is red and the mean line is green. The original length line is blue.
Mean or median values caould be used on numerical data in cases where the missing data is randomly ommited.
If the graph is skewed, not symetrical, then we should use the median to replace missing values.
Click on the + key to create a new frame then click copy text button and paste the contents into the frame.
Run the code in all of the frames.
The length column is brought back. Original lengths are still in there, but the NaN values are replaced with the mean of 21.
The median length and mean length columns are no longer needed and they are dropped. Axis = 1 indicates dropping a column. Axis=0 means dropping a row. The the first 35 records are printed out
Day 3: Replacing missing categorical data: power, type
Categorical data that is missing cannot be replaced with the mean or median, since the categorical data is not numeric, We can use the mode, however. The mode is the most often occuring data.
Missing power of boats
Click on the + key to create a new frame then click copy text button and paste the contents into the frame.
Run the code in all of the frames.
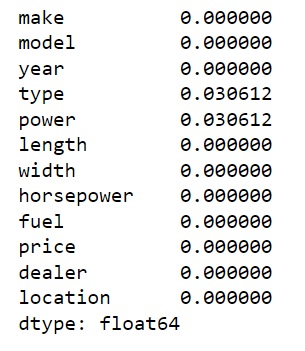
We are loading a different version of our boats data base. It contains missing categorical data instead of missing numerical data.
Look at the printout and see if you can locate the NaN values in categorical columns.
Click on the + key to create a new frame then click copy text button and paste the contents into the frame.
Run the code in all of the frames.
Here is the output from this frame.
Now let's graph the data to find the mode for power and type of boat.
Click on the + key to create a new frame then click copy text button and paste the contents into the frame.
Run the code in all of the frames.
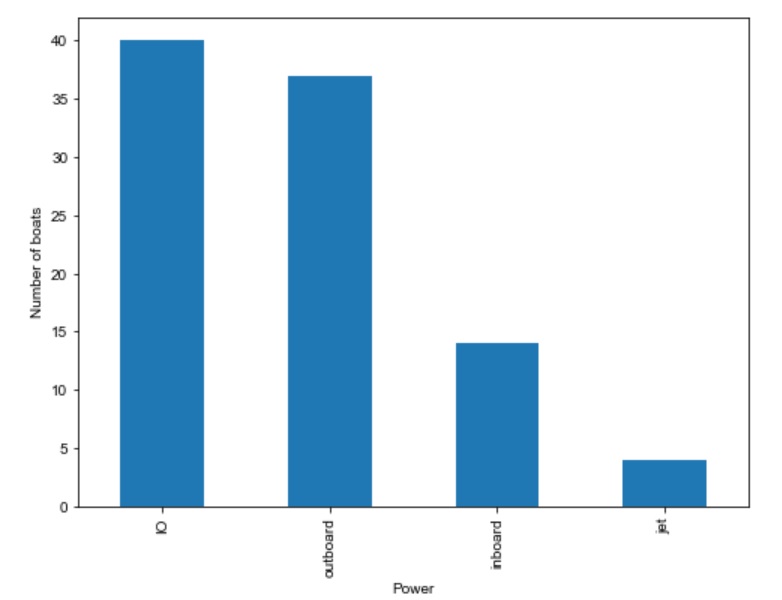
Here is the output from this frame.
From our graph we can see that the most frequenly appearing boat is an inboard/outboard. This is the mode of this categorical distribution.
Now we can see that the most frequent boat in the dataset is an inboard/outboard, followed by outboards, inboards and jet boats.
Now we need to replace the NaN power column with "IO".
Click on the + key to create a new frame then click copy text button and paste the contents into the frame.
Run the code in all of the frames.
Here is the output from this frame.
Look at the output from the lines of code and verify that the NaN in the power column has been replaced with "IO".
Now we need to do the same thing for type of boat. We have runabouts, fishing boats,wake boats, etc.
Copy the following code in the textarea box below.
Type of boats
Click on the + key to create a new frame then click copy text button and paste the contents into the frame.
Run the code in all of the frames.
Here is the output from this frame.
runabout
dtype: object
As you can see from the output, runabouts are the largest group of boats in the dataset.
Click on the + key to create a new frame then click copy text button and paste the contents into the frame.
Run the code in all of the frames.
In the Python program, you should see that all of NaNs in the type column were replaced with 'runabout' which is the mode.
Missing boat dealers
In some cases when you have missing categorical data in a dataset, you can create an arbitary category. Let's call it "missing". If, for example, we are missing a few boat dealers, we could fill in the NaN with "missing".
First we need to find out which ones we are missing information about the dealer. We are going to use another copy of the boats dataset.
Click on the + key to create a new frame then click copy text button and paste the contents into the frame.
You will have to adjust where the file comes from.
Run the code in all of the frames. and look for the ones that have NaN for the name of the dealer
Now let's look at the dataset for missing data in all columns. Create a new frame and key in this line boats_data.isnull().mean()
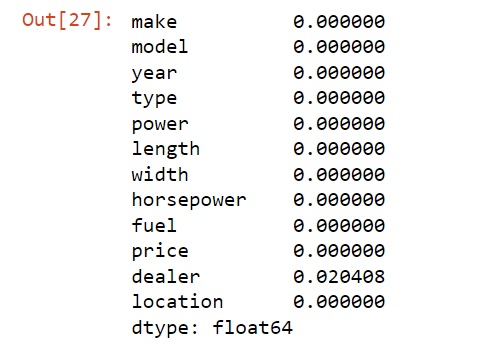
The output should loook like the following.
You can see that there are about 2% of the dealer names missing from our dataset.
We are going to convert these NaNs to the word "missing".
Create a new frame and type the following two lines, save and run this block of code: