Day 1: Installing Python and Geany
Python is a cross-platform programming language. It runs on all the major operating systems. Python comes with an interpreter
that runs in a terminal window, allowing you to try out pieces of code without having to save them and run an entire program.
You will also work with a text-editor called, Geany which allows you to save and edit your programs. Our focus here is on
the Windows operating system using Python 3, which is the newest version as of this writing.
Although Python allows you to write many kinds of programs, the focus of this lesson is on how to use it to create interesting
and interactive graphs to be used in business presentations like a business plan, marketing plan, financial reports, newsletters,
sales catalogs.
Let's check to see if Python is installed on your machine. Open a Terminal window by typing Command in the search box
and then click on The Command Prompt. Your screen should look like this.
To see if Python is installed, type Python
If it is installed you will see a screen, showing the version that is installed. Your screen should look like the one pictured below.
if Python is installed.
Windows does not always come installed with Python, so you will need to download it to the downloads folder and then install it. To begin, hold down the shift key and right-click the desktop to open the command window.. In the terminal window, enter python in lowercase letters. If sit is not installed, you will probably get and error message telling you that it is not a recognized command.
To download Python go to Python downloads
Go to the computer downloads' folder and click on the application to install Python. Follow screen instructions to complete
the process. Make sure that you click the Add Python to PATH box
For more detailed and excellent information,
you may want to purchase a textbook, entitled "Python Crash Course by Eric Matthes." It is and excellent, well-written and well-edited
textbook on Python.
To download a text-editor program that this textbook suggests for beginners, go to geany text editor
Under Downloads click on Releases and then on the latest version for Windows, which as this date was geany-1.33 setup.exe
In your downloads folder click on the setup.exe file for Geany and follow on-screen instructions to install the text-editor to your computer.
Configuring Geany
To configure the text editor, Geany, checkout the video link below
Configuring Geany text editor video
Day 2: First Python program
Key in the following program into your Geany text-editor
Now click on Execute to see how the program works. Your results should be similar to those shown below.
Day 3: Scalable Vector Graphics
svg is an image file format like jpegs, bitmaps, gifs, etc. Jpeg's, bitmaps, and gifs are all composed of pixel data.
Collectively they are called raster graphics. Scalable vector graphic are created using computational instructions on how to
draw images on the screen. Raster graphics when resized, zoomed in or zoomed out, pixelate, break apart or lose some of their clarity. SVG images do not loose clarity when resized and are therefore ideal for use in responsive design applications that are written for computers, tablets and cell phones.
Adobe Illustrator can be used to create scalable vector graphics or you can create them using Python, which is what we will focus
on in this lesson.
Pygal is a Python visualization package that we will use to produce scalable vector graphics files.
These files are useful in visualizations that are presented on different sized screens. In this lesson, we will create svg graphs.
Installing PYGAL using pip
Shift and right-click desktop
Type the drive letter where Python resides, if different than C:\
If necessary, change the directory to where your Python program was installed. For example, if your Python program was installed in a folder called PythonWork, then type CD PythonWorkType pip install pygal
Creating your first svg graphic file - a pie chart showing market share for surfboard manufacturers.
Run Geany text editor
File - New
File - Save As. Give file a name with a .py extension.
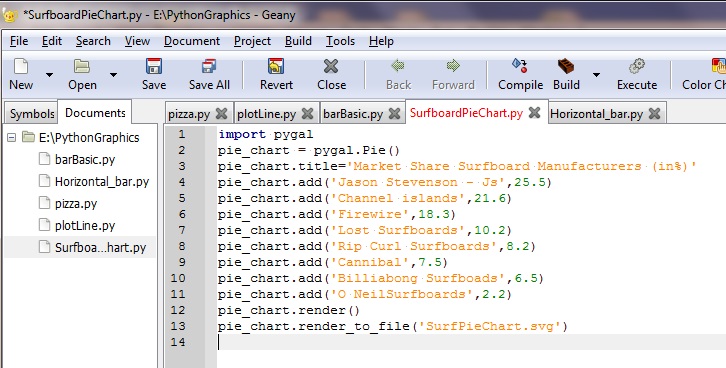
In the editor, key in the program to create the pie chart
import pygal
pie_chart = pygal.Pie()
pie_chart.title='Market Share Surfboard Manufacturers (in%)'
pie_chart.add('Jason Stevenson - Js',25.5)
pie_chart.add('Channel islands',21.6)
pie_chart.add('Firewire',18.3)
pie_chart.add('Lost Surfboards',10.2)
pie_chart.add('Rip Curl Surfboards',8.2)
pie_chart.add('Cannibal',7.5)
pie_chart.add('Billiabong Surfboads',6.5)
pie_chart.add('O NeilSurfboards',2.2)
pie_chart.render()
pie_chart.render_to_file('SurfPieChart.svg')
Save the file with a .py extension
Click on Run and use the browser of your choice.
The immediate results are a blank terminal window
When you run the program, you will not immediately see the results of your work. To see the results of your work,
you need to de the following:
Open up Chrome, Firefox or Internet Explorer
Type CTRL + O to open a file
Navigate to the folder where you saved the svg file
Click on it
Click Open
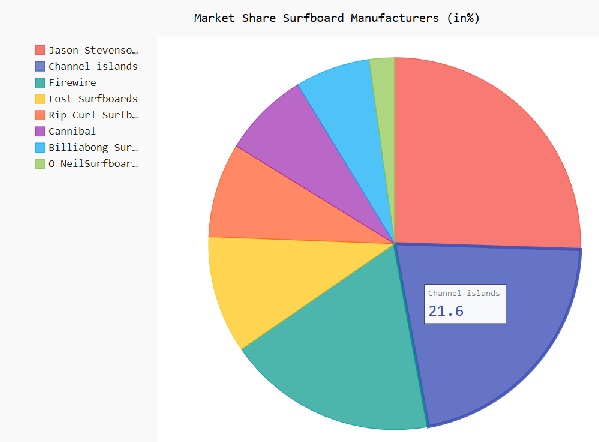
A legend has been created on the left side of the screen. Colors were assigned to each of the surfboard manufacturers.
The pie chart contains a slice that matches the color in the legend and reflects the percentage of market share.
You will notice that the graphic has some animation built in. Move the cursor over one of the pieces of the pie. You should see the name of the company that corresponds to each section of the pie chart and the percentage market share. As you can see, this kind of graphic is much more interesting than a bitmap, jpeg or gif.
Not all browsers show the percentage data when you hover over the graph.
Day 4: Half pie chart showing first quarter sales of longboards, short boards, wetsuits, clothing, stand-up paddle boards
This vector graphic is similar to the full pie chart that we just constructed. The code is almost identical with a few minor exceptions: the type, title and file to be saved. Key in the following code into Geany text editor. Save the file and call it rinconSurfShopSales.svg .
Run Geany text editor
File - New
File - Save As give file as rinconSurfShopSales.py .
In the editor, key in the program to created the half-pie chart
import pygal
pie_chart = pygal.Pie(Half_pie=True)
pie_chart.title='Rincon Surf Shop Product Sales (in %)'
pie_chart.add('Long Boards',10.5)
pie_chart.add('Short Boards',11.6)
pie_chart.add('Stand-up Paddle boards',2.3)
pie_chart.add('Wetsuits',3.2)
pie_chart.add('Apparel',45.75)
pie_chart.add('Footwear',16.5)
pie_chart.add('Accessories',10.15)
pie_chart.render_to_file('RinconHalfPieChart.svg')
Save the file with a .py extension
Click on Run and use the browser of your choice.
The immediate results are a blank terminal window
Double click on the newly created file or use CTRL + O and open it in a browser.
Printout a copy for your instructor or demonstrate it to them.
Day 5: Line Graph
Food trucks are a very unique market and one of the lessons available at Janet Belch Web site is on how to start your own food truck business. Your assignment here is to make a scalable vector line graph showing the profit of 10 corporate food truck companies from January - June 2018. The numbers are made up. In theory, since they are corporations, the information would be available. For our purposes, we will go along with hypothetical data.
Company Jan Feb Mar Apr May Jun Red Robin $18,000 $18,500 $18,750 $19,460 $20,000 $22,000 Johnny Rocket $17,500 $18,000 $18,250 $19,160 $19,500 $19,800 Taco Bell $16,500 $17,000 $18,050 $17,160 $17,500 $18,800 Sizzler $15,500 $15,000 $15,050 $13,160 $17,500 $16,800 Jack in the Box $16,000 $17,000 $17,050 $14,160 $16,500 $17,800
Using the data above, make a scalable vector line graph. The first few lines are listed below. Please make a line for each of
the other food trucks. The last two lines needed to complete the graph are provided for you.
After executing the graph in Geany, demonstrate to your instructor the finished .svg product or use a screen capture of your
finished graph using the print screen key and then paste it into Paint and print it out.
import pygal
line_chart = pygal.Line()
line_chart.title = 'Food Truck Sales January - June (in $)'
line_chart.x_labels = ['Jan', 'Feb', 'Mar', 'Apr', 'May', 'Jun']
line_chart.add('RedRobin',[18000,18500,18750,19460,20000,22000])
.....
.....
.....
.....
line_chart.render()
line_chart.render_to_file('FoodTruckLineChart.svg')
Day 6: Horizontal bar graph for a food truck start up costs
Make a horizontal bar graph using the following information about start-up costs for a food truck business. The truck costs $85,000; inventory, $1,500; permits and licenses, $300; website, $100; cash register-pos, $500; uniforms, $500; pots and pans, $1,500; fire extinguisher, $150. The code for the horizontal bar graph is line_chart = pygal.HorizointalBar() . Come up with title and file name to render to. See previous examples if you are unsure of the code.
Now let's make a basic bar graph reflecting an estimate of a food truck company's operating expenses. The first basic bar graph line of code after importing pygal is line_chart = pygal.Bar() Come up with an appropriate title and file name. The information about the operating expenses is as follows: Cost of good sold, $79,200; website, $120; salary expense, $70,200; Repairs expense, $600; Advertising, $600; Supplies, $600; Depreciation, $4,572; Insurance, $1,800; Misc. $600; Payroll Taxes, $8,376; Utilities, $600; Interest, $3,086; Fuel, $3,000.
Day 7: Putting your scalable vector graph into an HTML document
The code listed above is needed to insert an svg image into html5. Use the object tags.The object type describes the XML (Extensible Mark-up Language data file.The XML file is formatted much like .html document uses, but used custom tags to define objects and the data within each object. The files can be opened in Notepad or Notepad++. You can specify height and width just like a regular image tag. Below is and example of an svg xml file.