Open your Python Notebook that you just created. Add a cell and copy and paste in the following information.
Click copy text button and paste the contents into the cell.
Run this cell. Either skip over the cell that was designed to create a folder or delete it.
CSV file format stores the data as rows separated by commas.
The map function joins the columns.
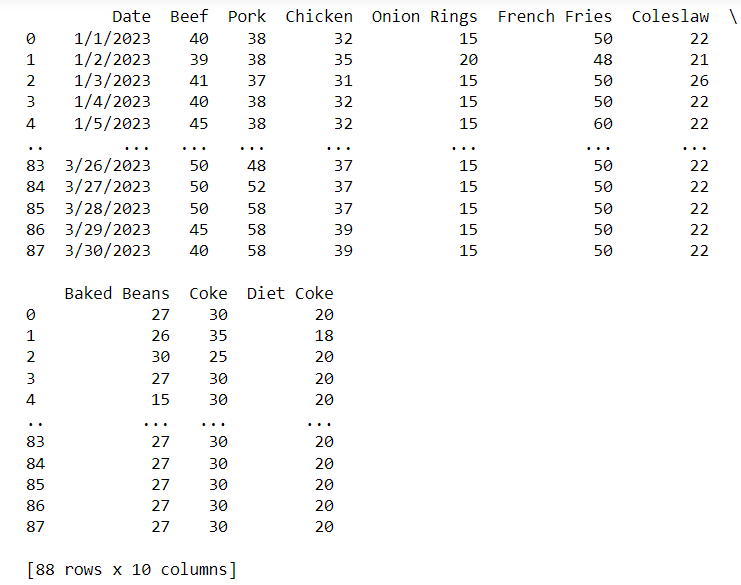
Run this cell. Your output should look like the image below.
The image shows the date, number of beef, pork and chicken sliders sold that day as well as onion rings, french fries, coleslaw, baked beans, Coke and diet Coke sold.
The top lines show January sales and the bottom half shows March sales. Our files have been combined containing 88 rows and 10 columns.
If you want to see the entire dataframe, key in the following line in a new cell and then run it.
print(df.to_string())
Let's suppose we want to see which of the three months had the best sales and how much the sales were for that month. We are going to add a column called "Month" to help accomplish this task.
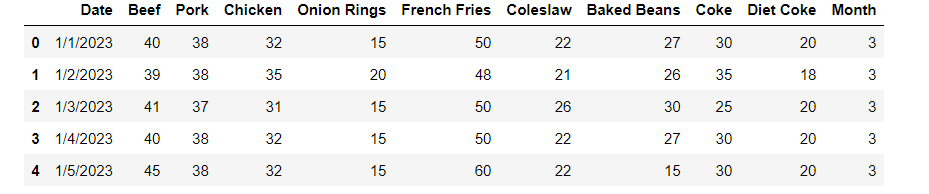
Key in the following lines in a new cell to add a Month column. Next we get the first digit of the date to obtain the correct month. Lastly we print the top few lines to check and see if our code worked. Run your code starting with the first cell.
#create a variable consisting of the first digit of the month
df['Month'] = df['Date'].str[0:1]
df.head()
Click copy text button and paste the contents into a new cell. Run your code starting with the first cell. Here we are converting the month variable, which is a string to a number.