Click the plus sign to create a new frame and type in the following information. from sklearn.model_selection import train_test_split
This imports sklearn from Python's library.
Sklearn contains tools for machine learning and statistical modeling.
Frame 9
Click the plus sign to create a new frame and type in the following information. X_train, X_test, y_train, y_test = train_test_split(X, y, test_size=0.2, random_state=0)
This line divides the data into training and test sets. Eighty percent is used for training and 20 percent makes up the test set which is used for testing the algorithum.
Frame 10
Copy code that reads creates a variable clf and fits it to our model.
Click on the Plus sign on the menu bar (insert cell below) to add a new frame to the project.
Click in that frame.
Press CTRL V to paste text into Python.
Click on file and save it as gradesExcel.ipynb
Now it is time to make some predictions from the test data.
Frame 11
Copy code that will make predictions about which students should pass or fail.
Click on the Plus sign on the menu bar (insert cell below) to add a new frame to the project.
Click in that frame.
Press CTRL V to paste text into Python.
Click on file and save it as gradesExcel.ipynb
Now go to frame one,click and run.
After each click you will advance one frame, continue running each frame until you get prediction output that looks like the image below.
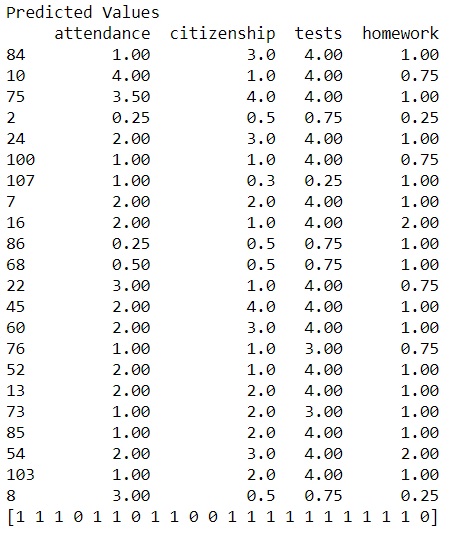
Let's look at our results.
Twenty two records were selected at random from the dataset containg 108 records.
A list of grades for each independent variable were given for each.
At the bottom of the list are the predictions for each randomly selected one.
The passing and failing grades are enclosed in square brackets.
[1 1 1 0 1 1 0 1 1 0 0 1 1 1 1 1 1 1 1 1 1 0]
A "1" means pass and a "0" means fail.
Five are predicted to fail.
Record 2 original data was .25,.50,.75,.25 with a failing grade.
Our model predicted that with these marks, student 2 should fail
Student 107 should also fail.
Student 86 should also fail based on our model
If you do not specify the random state in code, then everytime you execute your program, a new random value is generated and the train and test data sets would have different values.
Confusion Matrix
To evaluate the performance of a random forest classifier, we will use a confusion matrix.
A confusion matrix is a mold or container that allows you to visualize the performance of the classification machine learning models. With this visualization, you can get a better idea of how your machine learning model is performing.
A matrix, in mathematics, is a rectangular array of quantities or expressions set out by rows and columns.
A confusion matrix shows true positives, true negatives, false positivies and false negatives.
In our model a true positive is one that was declared passing in the actual number and the prediction also.
A true negative, in our example, is one that shows a student failing in the actual data and also failing in the prediction.
A false positive is one in which the actual data showed the student failing and the prediction had them passing.
In our model a false negative means that the actual data shows a student failing and the prediction shows them passing.
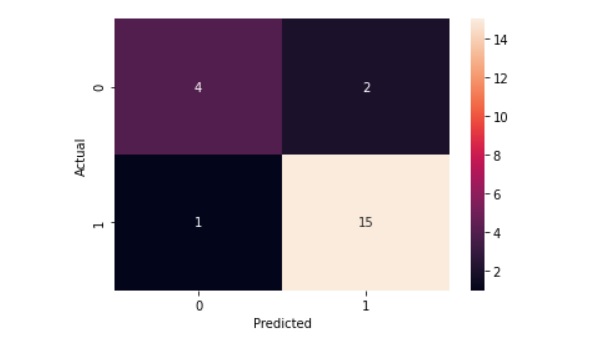
Here is the confusion matrix for our Random Forest Classifier model.
There four True Negatives.
There 15 True Positives.
There 2 False Positives.
There is one False Negative.
The table below shows how these numbers were determined.
Record #
Prediction
Actual
Type
84
1
1
TP
10
1
1
TP
75
1
1
TP
2
0
0
TN
24
1
0
FP
100
1
1
TP
107
0
0
TN
7
1
1
TP
16
1
1
TP
86
0
0
TN
68
0
0
TN
22
1
0
FP
45
1
1
TP
60
1
1
TP
76
1
1
TP
52
1
1
TP
13
1
1
TP
73
1
1
TP
85
1
1
TP
54
1
1
TP
103
1
1
TP
8
0
1
FN
Here is the code that produces the confusion matrix.
Frame 12
The accuracy of the model was determined by adding True Positive (17) and True Negative (5) and dividing by the total number of randomly selected items (22) to get accuracy of 1.0.
Here is the code to find the accuracy of the model.
Frame 13
Copy code that will determine the accuracy of the model
Click on the Plus sign on the menu bar (insert cell below) to add a new frame to the project.
Click in that frame.
Press CTRL V to paste text into python.
Click on file and save it as gradesExcel.ipynb
Now go to frame one,click and run.
After each click you will advance one frame, continue running each frame until you get the accuracy.
You can also get a single predicted result by entering a student's scores in the prediction = clf.predict([[0,0,0,0]]) line of code.
Next we need to see which of the independent variable, features of importance, contribute the most to grade determination.
The variables responsible for determining the students' grades are attendance, citizenship, tests and homework. Which of these is the most important?
Here is the code needed to make the prediction.
The first line of this code allows the user to enter one student's grades to see if they should pass or fail.
Frame 14
Copy code that will determine the features of importance
Click on the Plus sign on the menu bar (insert cell below) to add a new frame to the project.
Click in that frame.
Press CTRL V to paste text into Python.
Click on file and save it as gradesExcel.ipynb
Now go to frame one,click and run.
After each click you will advance one frame, continue running each frame until you get feature importances output that looks like the list below.
Results will be similar with these.
Most important criteria for DETERMINING PASS OR FAIL
2 0.464878
1 0.405681
0 0.117716
3 0.011725
As you can see they are ranked most important to least important.
Now let's analyze what this model has predicted here.
Remember the array numbers for the independent variables.
Array #
Variable
Importance
0
Attendance
0.117716
1
Citizenship
0.405681
2
Tests
0.464878
3
Homework
0.011725
According to our results, the most important feature influencing grades awarded is tests.
The least important variable is homework.
The model also provides the capability of entering just one set of independent variables and when the model is run, it will predict if those values mean pass or fail.
The line is :prediction = clf.predict([[4.0,3.0,1,0]])
These numbers should produce a passing grade of 1.
Frame15
Copy code that will determine the features of importance to make a graph
Click on the Plus sign on the menu bar (insert cell below) to add a new frame to the project.
Click in that frame.
Press CTRL V to paste text into Python.
Click on file and save it as gradesExcel.ipynb
Now go to frame one,click and run.
After each click you will advance one frame, continue running each frame until you get the graph of the features of importance.
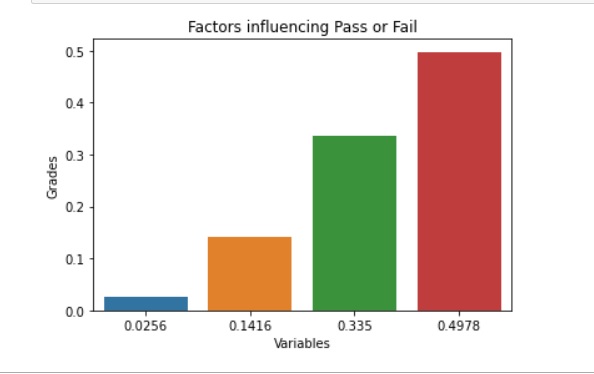
After our model has determined the most important variables influencing the grade awarded, a visualization of that information would be helpful.
The bar graph below does just that.
The red bar shows the most important feature: tests.
The green bar shows how citizenship affects our grade.
The yellow bar shows the influence of attendance on the grade.